What We Eat
June 2020 | By Laurie Frick in collaboration with Google Arts and Culture Lab
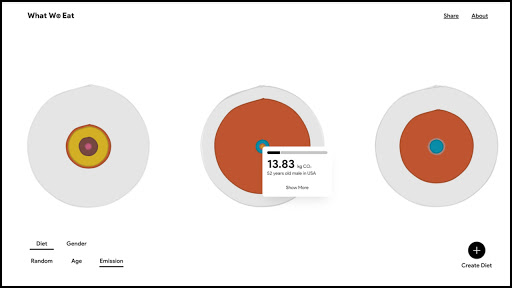
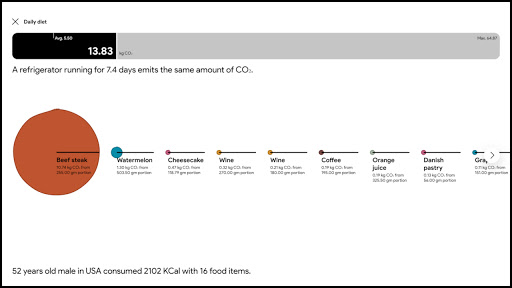
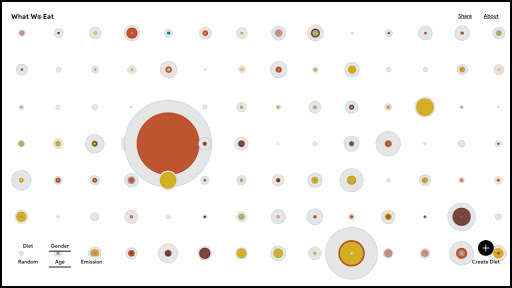
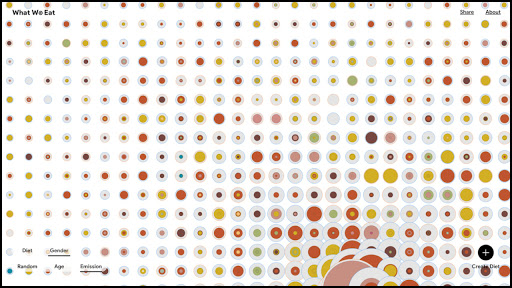
Explore the CO2 footprint for individual foods and diets in the US, France and UK. All data and its analysis provided by the artist.
Collections:

A climate data experiment as part of Heartbeat of the Earth.
Delve into Laurie Frick’s hand-drawn data visualisations of what we eat, colour coded and sized by CO2 data from the USDA, Datagouv.fr and UK Data centre.
Laurie Frick with development support from zigzag
Scientific validation: Diego Rose, Martin Heller (Tulane and Michigan Universities)
The artist interpreted the data from USDA, Datagouv.fr and UK Data centre
Team: Clare Brooks